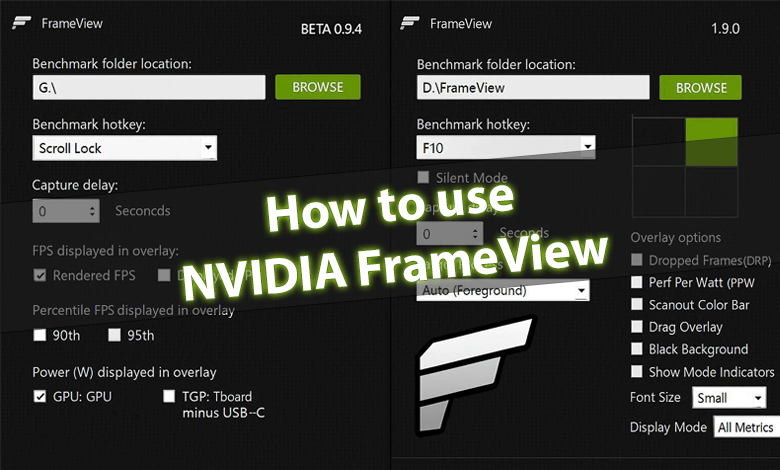
How to use NVIDIA FrameView

NVIDIA has introduced FrameView, a tool for analyzing GPU performance and power consumption. It supports a wide range of graphics cards, including AMD GPUs. FrameView is compatible with DirectX 9, 10, 11, and 12, OpenGL, and Vulkan APIs, as well as Universal Windows Platform (UWP) applications.
This article explains how to use NVIDIA FrameView. The application measures frame rate, performance per watt, and logs benchmark results. It relies on the NVIDIA FrameView SDK — the same monitoring engine used in the NVIDIA App. However, on AMD graphics cards, it displays a value that falls between chip power and board power rather than actual power consumption.
Table of contents:
Downloading and installing NVIDIA FrameView
On the official NVIDIA website, find the FrameView application and click Download Now. Run FrameViewSetup.exe to start the installation. Once the installation is complete, a FrameView shortcut will appear on your desktop.
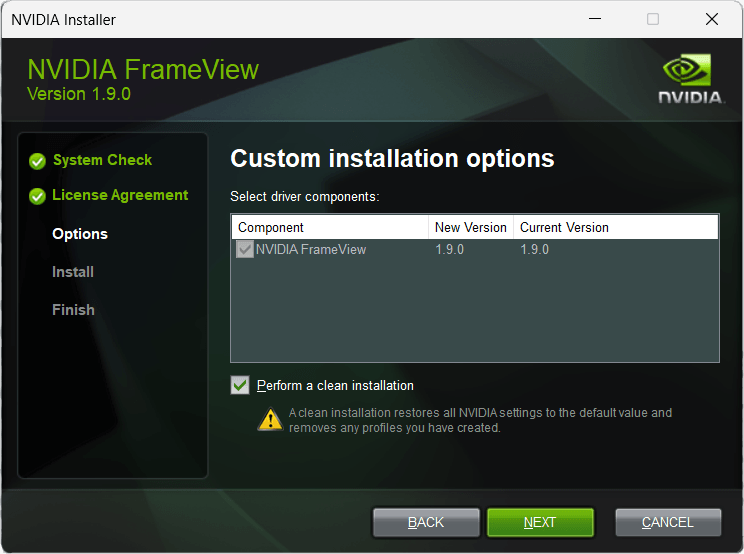
If necessary, you can perform a clean installation. In the Options section, select Custom and click NEXT, then check Perform a clean installation. All application settings and previously saved data will be removed.
How to enable the NVIDIA FrameView overlay
Run FrameView as an administrator. First, click BROWSE and select the Benchmark folder where the benchmark results will be saved. For the Display Mode setting, choose All Metrics. Then press Scroll Lock or F10 to start recording.
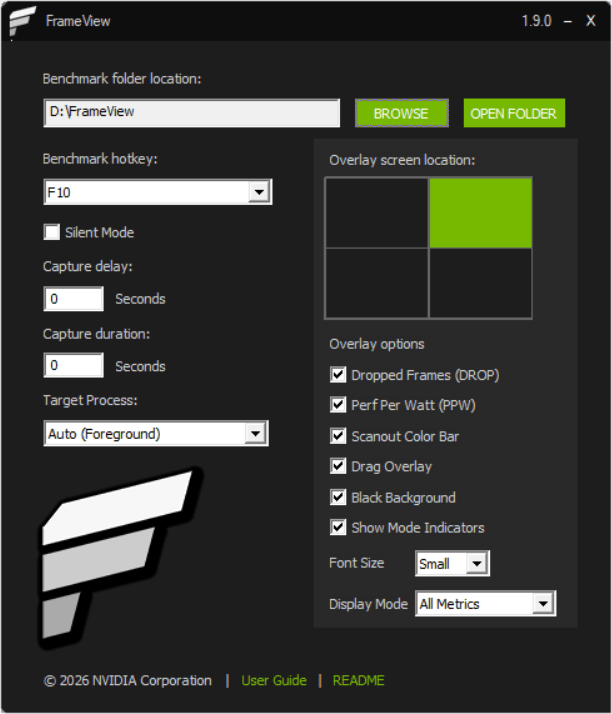
If you press this key again, the overlay will be disabled. However, data collection will continue, and the Benchmark Summary will not appear until the key is pressed once more. The data collected during testing will be saved as a CSV file, with the application name and a timestamp in the filename.
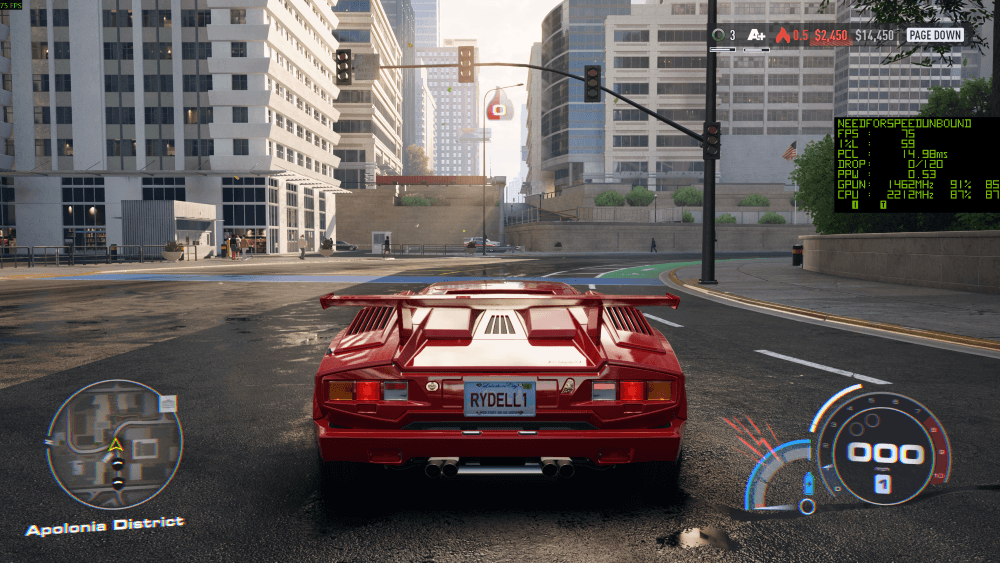
By the way, these metrics can not only be increased or decreased, but also repositioned by dragging them with the mouse. This functionality was not available in earlier versions of FrameView.
Understanding NVIDIA FrameView metrics
In the beta version of FrameView, the overlay displayed CHP (GPU Only Power) and TGP (Total board minus USB-C) values. The former indicates the power consumed by the graphics chip in watts. The latter represents the power consumed by the GPU and the board, excluding any power drawn by USB-C devices.
| Label | Metric | Description |
| FPS | Avg FPS | Average frame rate calculated from rendered frames. |
| 1%L | 1% Low FPS | The average frame rate of the slowest 1% of frames. The closer the 1% Low value is to the average FPS, the more consistent the performance. |
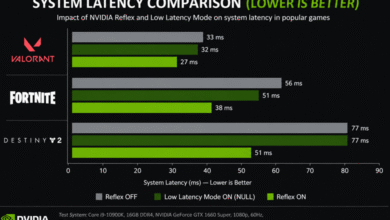
| PCL | AvgPCLatency (ms) | The average time between receiving user input on the PC and displaying the corresponding frame on the screen. |
| DROP | Dropped Frames | Indicates whether a frame was dropped (1) or displayed (0). |
| PPW | Perf Per Watt | Measures the number of frames rendered per unit of energy consumed. |
| GPUN GPUA GPUI |
GPU Frequency | Graphics processor frequency (MHz). |
| GPU % Utilization | Graphics processor utilization (%). | |
| GPU Temperature | Graphics processor temperature (°C). | |
| CPU | CPU Frequency | Processor frequency (MHz). |
| CPU Utilization | Processor utilization (%). | |
| CPU Temperature | Processor temperature (°C). |
The overlay tags also include information about game settings that may affect the final benchmark results.
| F | The game is running in full-screen mode, ensuring accurate performance measurements at the selected resolution. |
| I | In Independent Flip (iFlip) mode, the application emulates Full Screen Exclusive behavior. This mode is typically used to minimize latency. |
| T | Indicates that the game is running with vertical synchronization disabled. Screen tearing may occur, but maximum performance can be measured. |
| W | The game is running in windowed mode. The Alt + Enter keyboard shortcut can be used to force it into full-screen mode. |
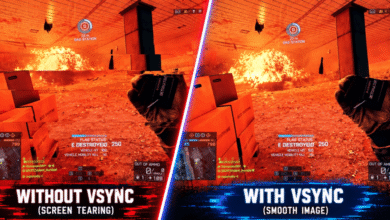
| V | Vertical synchronization is enabled, causing the game’s frame rate to synchronize with the monitor’s refresh rate. |
Benchmark recording and analysis
The benchmark folder specified in the FrameView user interface stores CSV files that can be opened in Microsoft Excel or Google Sheets. Once benchmarking is complete, two files will be created:
- FrameView_Summary.csv — contains aggregate statistics.
- FrameView_<Application>_YYYY_MM_DDTHHMMSS_Log.csv — contains per-frame data.
The following table explains each column header, as the log file contains significantly more data. It will help you understand the available metrics and identify the most important ones. The Present() function submits a completed frame for display.
| TimeInSeconds | Time elapsed since the start of statistics recording. |
| MsBetweenSimulationStart | Time interval between the start of processing for two consecutive frames. |
| MsBetweenPresents | Time interval between Present() calls for two consecutive frames. |
| MsBetweenDisplayChange | Time interval between the actual display of two consecutive frames on the screen. |
| MsInPresentAPI | Execution time of the graphics API Present() call. |
| MsRenderPresentLatency | Latency between the Present() call and the completion of frame processing. |
| MsUntilDisplayed | Time from the start of rendering until the frame is actually displayed. |
| Render Queue Depth | Number of frames simultaneously queued for rendering. |
| MsPCLatency | Time between receiving PC input and submitting the frame to the display. |
| Frame Gen Multiplier | Frame generation multiplier, if frame generation is enabled. |
| GPU0Clk (MHz) | Current GPU core clock frequency. |
| GPU0MemClock (MHz) | Current video memory clock frequency. |
| GPU0Util (%) | Current GPU utilization. |
| GPU0Temp (C) | Current GPU temperature. |
| Perf/W Total(F/J) (API) | Overall system energy efficiency, measured as the number of frames produced per joule of energy consumed. |
| Perf/W GPUOnly(F/J) (API) | GPU-only energy efficiency, measured as the number of frames produced per joule of GPU energy consumption. |
| Perf/W Total-USBC(F/J) (API) | Overall energy efficiency excluding power consumption through the USB-C port. |
| GPUOnlyPwr(W) (API) | Power consumed by the graphics chip only. |
| NV-Total-USBCPwr(W) (API) | Total NVIDIA graphics card power consumption (board + GPU), excluding power delivered through USB-C. |
| NV Pwr(W) (API) | NVIDIA graphics card power consumption. |
| CPUClk (MHz) | CPU clock frequency. |
| CPUUtil (%) | CPU utilization. |
| CPU Package Temp (C) | CPU temperature. |
| CPU Package Power (W) | Total CPU power consumption. |
| CPU TDP (W) | Processor thermal design power (TDP). |
| CPUCoreUtil% [1] | Utilization of an individual CPU core. |
| Current Battery Capacity (Wh) | Current battery capacity. |
| Total Battery Capacity (Wh) | Total battery capacity. |
| Battery Percentage (%) | Current battery charge level. |
Of course, you can simply open the CSV file in Google Sheets and create a chart yourself. To do so, select the MsBetweenPresents column, for example, and choose Insert > Chart. This will create a line chart that helps identify microstuttering.
However, NVIDIA provides the FrameView_Analysis_Template.xlsm template with macros for Microsoft Excel. It can be used to organize imported data for easier analysis of benchmark results. The preconfigured template should be located in one of the following folders:
C:\ProgramData\NVIDIA Corporation\FrameView\
C:\Program Files\NVIDIA Corporation\FrameView\
C:\Program Files\NVIDIA Corporation\FrameViewSDK\
If the FrameView_Analysis_Template.xlsm file is missing, it can be downloaded separately. Alternatively, open the FrameViewSetup.exe installer using an archive utility such as 7-Zip or WinRAR. When opening the template for the first time, you may need to click Enable Content on the yellow security warning bar.
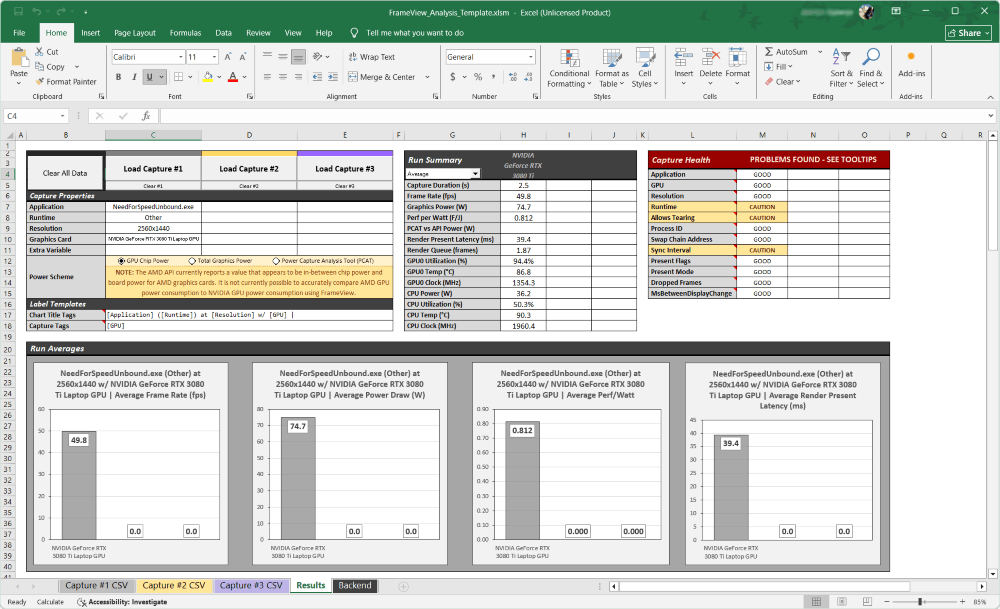
In the template, click Load Capture #1 and select the CSV file containing the benchmark data. A structured view of the data will then be generated, including tables and charts. To load another file for comparison, click Load Capture #2.
Final thoughts
NVIDIA FrameView is more than just a monitoring application — it’s a powerful performance analysis tool. It allows you not only to display FPS, but also to record detailed statistics on CPU and GPU performance, latency, and power consumption.
The collected data can be easily turned into charts for convenient analysis of gameplay smoothness. NVIDIA also provides the FrameView_Analysis_Template.xlsm template for Microsoft Excel, which includes a large number of preconfigured charts. In addition, many users rely on the free CapFrameX utility.