How to use FurMark 2

The classic FurMark is familiar to many users who have tested a graphics card at least once. The new version of the program retains the legendary “donut” — a complex 3D object. Rendering this scene creates a heavy real-time load on the GPU.
This article explains how to use FurMark 2 and interpret its results. Compared to FurMark 1, one of the most notable improvements is the addition of Vulkan support alongside OpenGL. The application now runs on both 32-bit and 64-bit versions of Windows and Linux.
Table of contents:
What is FurMark 2?
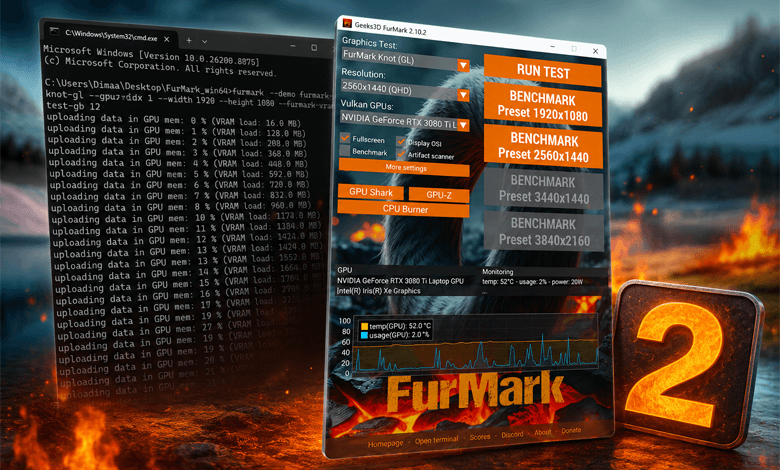
FurMark 2 itself is a command-line utility. In the Windows terminal, you can run various informational commands or start a benchmark test. Doing so automatically launches the FurMark_GUI graphical interface. The package also includes GPU-Z, GPU Shark, and CPU Burner.
| GPU-Z | Detailed graphics card information. |
| GPU Shark | Graphics card monitoring and hardware information. |
| CPU Burner | CPU stress testing under extreme load. |
On the official website, you can download FurMark 2 from the Downloads section either as a standard installer or as a portable version. The main advantage of the portable version is that it only needs to be extracted. Once extracted, the application can be used without installation, even from a USB flash drive.
How to test your GPU with FurMark 2
GPU stress test
Launch FurMark_GUI.exe and select FurMark (GL) for older graphics cards or FurMark (VL) for newer models. In the Resolution field, leave the default setting of 1920×1080 (FHD) or select your monitor’s native resolution (2560×1440 (QHD) in my case). Then click RUN TEST.
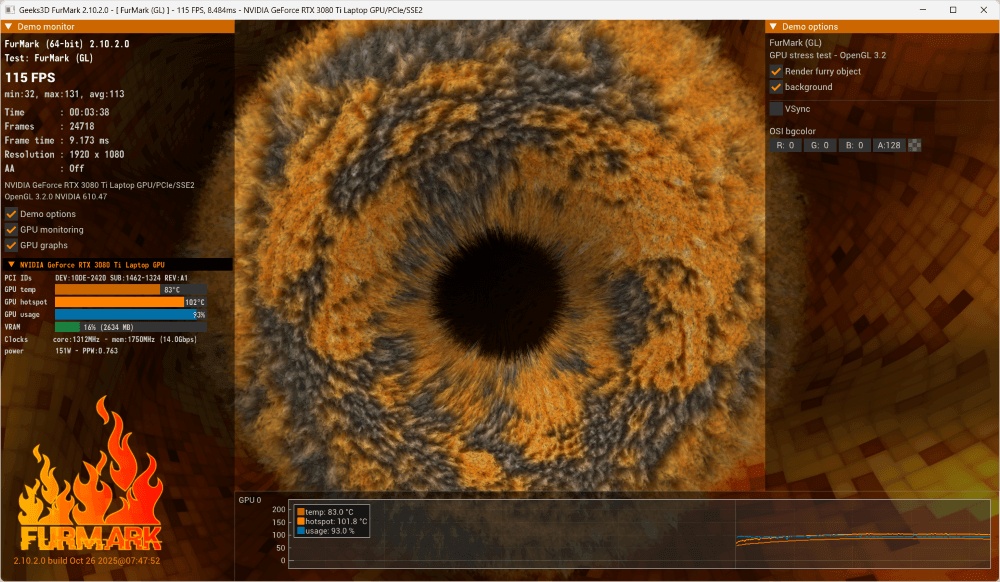
My laptop consistently delivers around 115 FPS. However, due to the balanced fan profile, the GPU Hotspot temperature exceeded 104°C. As a result, the GPU began to throttle, causing the frame rate to drop to 32 FPS. After increasing the fan speed, performance quickly returned to normal.
Running benchmarks
In the settings, enable Fullscreen and Benchmark. Select the desired graphics test and resolution, then click RUN TEST. Alternatively, use the BENCHMARK Preset 2560×1440 profile. After the benchmark is complete, enter a Username and click SUBMIT > Open Score.
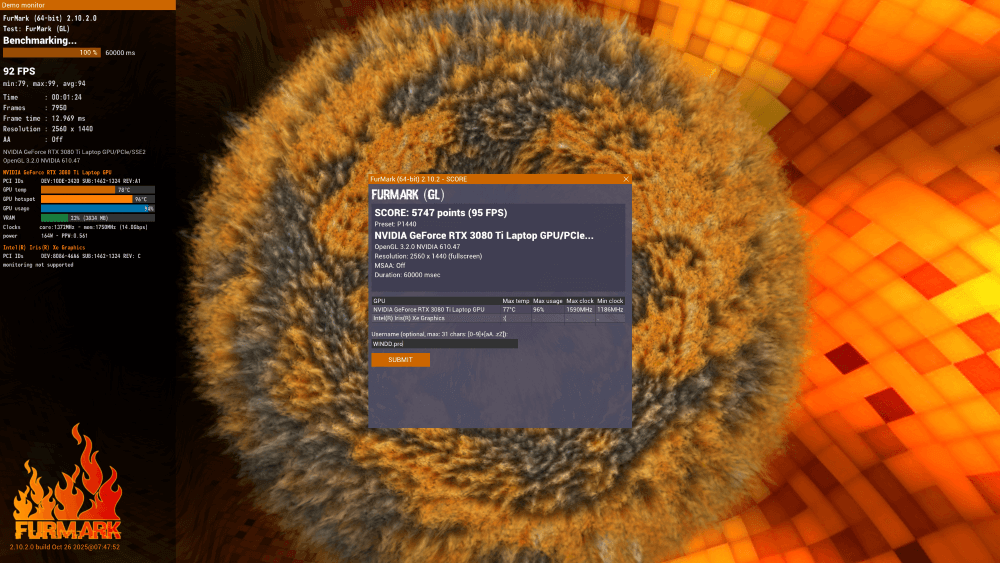
The page will display a summary of your benchmark results, including FPS, Score, and other metrics. Click Latest Scores to view the results of other users. FurMark 2 benchmark charts, such as the P1440 Charts, are also available for comparison. Overall, this allows you to evaluate your GPU’s performance.
Checking for artifacts
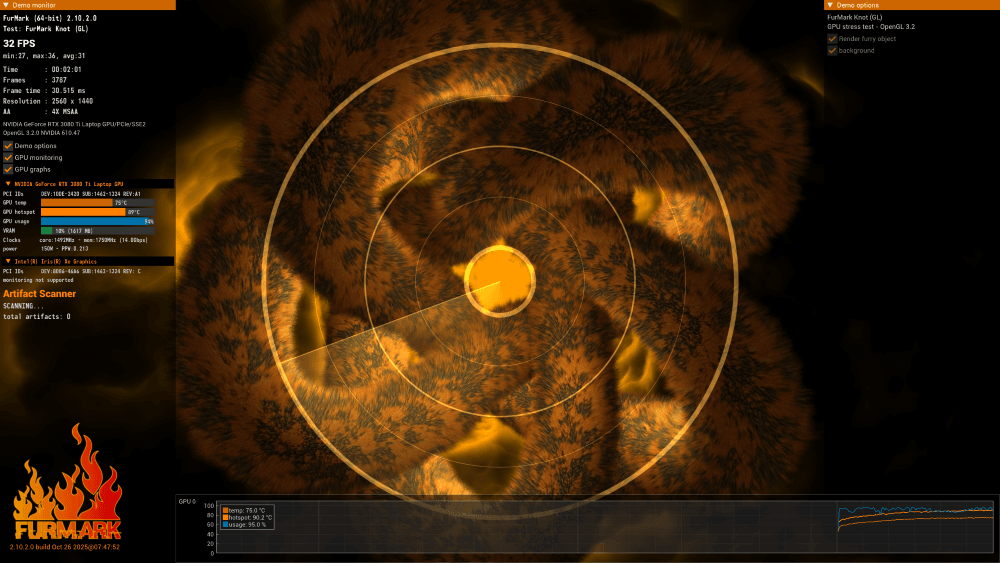
Enable Artifact Scanner and click RUN TEST. I also recommend setting Anti-Aliasing to 4X MSAA, as this brings the test conditions closer to actual gaming scenarios. If any artifacts are detected during testing, the totalartifacts counter will display their number.
Testing VRAM
On laptops with hybrid graphics, it is recommended to run FurMark 2 on the discrete GPU. This can be done using the –hpgfx 1 parameter, which enables high-performance mode. Open FurMark_GUI.exe, click Open Terminal, and then run the following command:
furmark --demo furmark-knot-gl --hpgfx 1 --width 1920 --height 1080 --furmark-vram-test-gb 12
In the command prompt, you can see the video memory being filled and the classic rendering test running. The left panel shows how much VRAM is in use, with the baseline value being 1700 MB. I selected 12 GB of video memory, but the actual usage reached 13.5 GB. Test the graphics card in this mode for 10 — 15 minutes.
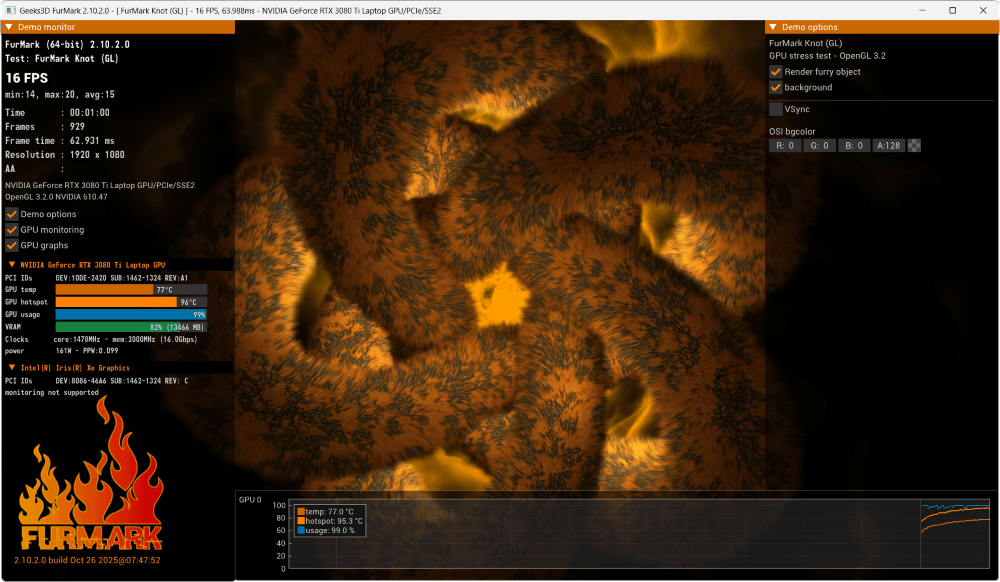
On desktop PCs, you can use the available preset configurations. In the FurMark_win64 folder, locate and run vram_test.bat. Enter the desired amount of video memory — 4, 6, 8, 10, 12, 16, 20, or 24 GB — and press Enter. It would be convenient to have this feature integrated directly into the FurMark_GUI interface.
Using command-line options
In Windows Terminal, run the command cd D:\FurMark_win64, then execute furmark –help. All available parameters will be displayed in the same window. The general command syntax is as follows: furmark [–option [value]]. Parameters can be combined to specify the test duration, screen resolution, and other settings.
--help print all options
--version show version
--check-new-version check for new version
--hpgfx value set the high performance graphics state (0 or 1). For laptops with hybrid graphics (iGPU + dGPU)
--width value set the width in pixels of the 3D window
--height value set the height in pixels of the 3D window
--fullscreen run the demo or graphics test in fullscreen
--title-bar enable (1) or disable (0) the title bar of the window. Default: 1 (enabled).
--msaa value set the number of samples for MSAA: 1, 2, 4 or 8
--x11-display-name set the display name on Linux / X11 using the following format: hostname:display_number.screen_number
--opengl-ver-major value set the major version of the OpenGL context.
--opengl-ver-minor value set the minor version of the OpenGL context.
--opengl-core-profile value enable (1) or disable (0) the OpenGL core profile.
--demolist print the list of available demos
--demo name run a demo from its name. Use --demolist for all available names
--demofile filename load and run a GeeXLab demo from a filename
--glinfo print a quick OpenGL report
--glinfo-all print a detailed OpenGL report
--glvendor print the GL_VENDOR value
--glrenderer print the GL_RENDERER value
--glversion print the GL_VERSION value
--vkinfo print a quick Vulkan report
--vkinfo-all print a detailed Vulkan report
--vkinfo-extension <name> info about a Vulkan extension. Should be used with --gpu-index
--gpuinfo print GPU info
--glnvarchinfo print information about NVIDIA GPU architecture
--gpu-index index set the GPU index (0-based) for Vulkan/OpenCL/CUDA demos or info
--print-render-speed print speed rendering info: frames, framerate, time step
--no-osi disable the OSI (On Screen Information)
--no-resize disable the resizing of the 3D window
--vsync number set the VSYNC (vertical synchronization) state
--disable-demo-options disable the display of the demo options
--p1080 benchmark preset 1920x1080 (FHD)
--p1440 benchmark preset 2560x1440 (QHD)
--p2160 benchmark preset 3840x2160 (4K UHD)
--benchmark benchmark the demo and displays the score box at the end unless no-score-box option is used
--duration-ms ms set the benchmark duration in milliseconds (only with custom settings, not in presets). Default: 60000
--max-time sec set the max duration of the demo / stress test in seconds. Default: 0 (no limit)
--max-frames set the max duration of the demo / stress test in frames. Default: 0 (no limit)
--no-score-box disable the score box at the end of the benchmark
--no-gpumon disable the GPU monitoring
--load-plugin-gpumon value enable (1) or disable (0) the loading of the GPU monitoring plugin. Default: 1
--log-gpu-data log GPU data into a CSV file
--log-gpu-index index index of the GPU for logging GPU data. Default: -1 (all GPUs)
--log-gpu-data-filename filename full path to the GPU data log file. Default filename is _gpu_date.time.csv
--gpu-monitor-print print GPU monitoring info
--hw-polling-interval ms set the GPU monitoring polling interval in milliseconds (default: 1000)
--disable-traces disable the generation of log and score files.
--disable-logfile disable the generation of the log file
--logfile-suffix suffix add a suffix to the log file name
--glmemory-print print OpenGL memory stats (NVIDIA OpenGL demos only)
--export-dir dir set the export folder for GPU data
--artifact-scanner run the artifact scannner
--artifact-scanner-interval set the scanning interval in milliseconds (default: 100)
--furmark-bkg-img-id number set the image for the dynanic background. Values: 0 to 3 - default is 0
--furmark-fur-img-id number set the image for the fur color. Values: 0 to 1 - default is 0
--furmark-bfc set backface culling (0 or 1). Default is 1. Not available in Presets
--furmark-dxt5 enable compressed textures (DXT5) in FurMark stress test. OpenGL only. Not available in Presets
--furmark-vram-test-gb set the size in GB used by FurMark data. Values: 0, 2, 4, 6, 8, 10, 12, 16, 20 or 24. Not available in Presets
--thread-affinity-mask mask set the thread affinity mask. Default is 0 (= affinity mask not used)
--thread-core core_index set the core (from 1 to n) on which the demo should run. Default is 0 (= core number not used)
--no-dpi-awareness disable DPI awareness on Windows platform
--no-dpi-scaling disable DPI scaling on Windows platform
--gpuz-print print GPU-Z sensors in the terminal
--gpuz-log-data log GPU-Z data into a CSV file
--dpi-scaling set / force the DPI scaling - default is 1.0.
How to compare FurMark 2 benchmark results
If the artifact test results are easy to interpret, the other benchmark results need to be compared against reference values. In the BENCHMARK 2560×1440 test, my RTX 3080 Ti Laptop GPU averages 91 FPS with a Score of 5522. The FurMark 2 P1440 results chart shows an expected value of around 84 FPS. Therefore, the GPU’s performance is within the normal range.
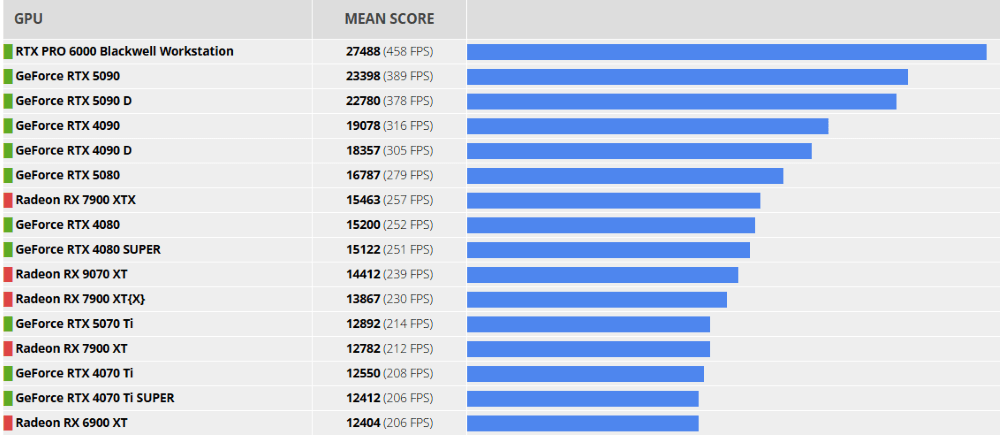
The program folder contains a file named _scores.csv, which stores the results of previous benchmark runs. It can be used to compare minimum FPS and Score values. To save benchmark results automatically, enable Enable FurMark Traces (log file) or use the –log-gpu-data parameter.
A stable temperature graph without sudden spikes indicates that the cooling system is operating efficiently. Testing showed that the GPU Hotspot temperature exceeded 104°C, causing the laptop to throttle. After some time, FPS drops were observed in every benchmark. This indicates that the laptop and its cooling system need to be cleaned. After maintenance, the GPU Hotspot temperature no longer exceeds 92°C.
Final thoughts
The updated FurMark 2 retains the classic “donut” and introduces another complex geometric object — the “knot”. The application now supports not only OpenGL but also Vulkan. It allows you to benchmark your GPU, check for artifacts, and compare your results with those of other users.
The command line provides access to all FurMark 2 features. In particular, VRAM testing is currently available only through the command line. For convenience, the program folder already includes a ready-made script that automates this process. It would be worthwhile to add this functionality to the FurMark_GUI graphical interface as well.